Visualize your data in a dashboard
In Dashboards you can visualize insights from your reports. Dashboards are made up of widgets, which represent data values from your reports in Table Explorer. A Dashboard can be shared exactly the same way as with reports via Collaborators.
Creating a new Dashboard
Click on Create Dashboard in the top right corner. Give your Dashboard a name and then click on Create. You will then end up in edit-mode and can add your widgets.
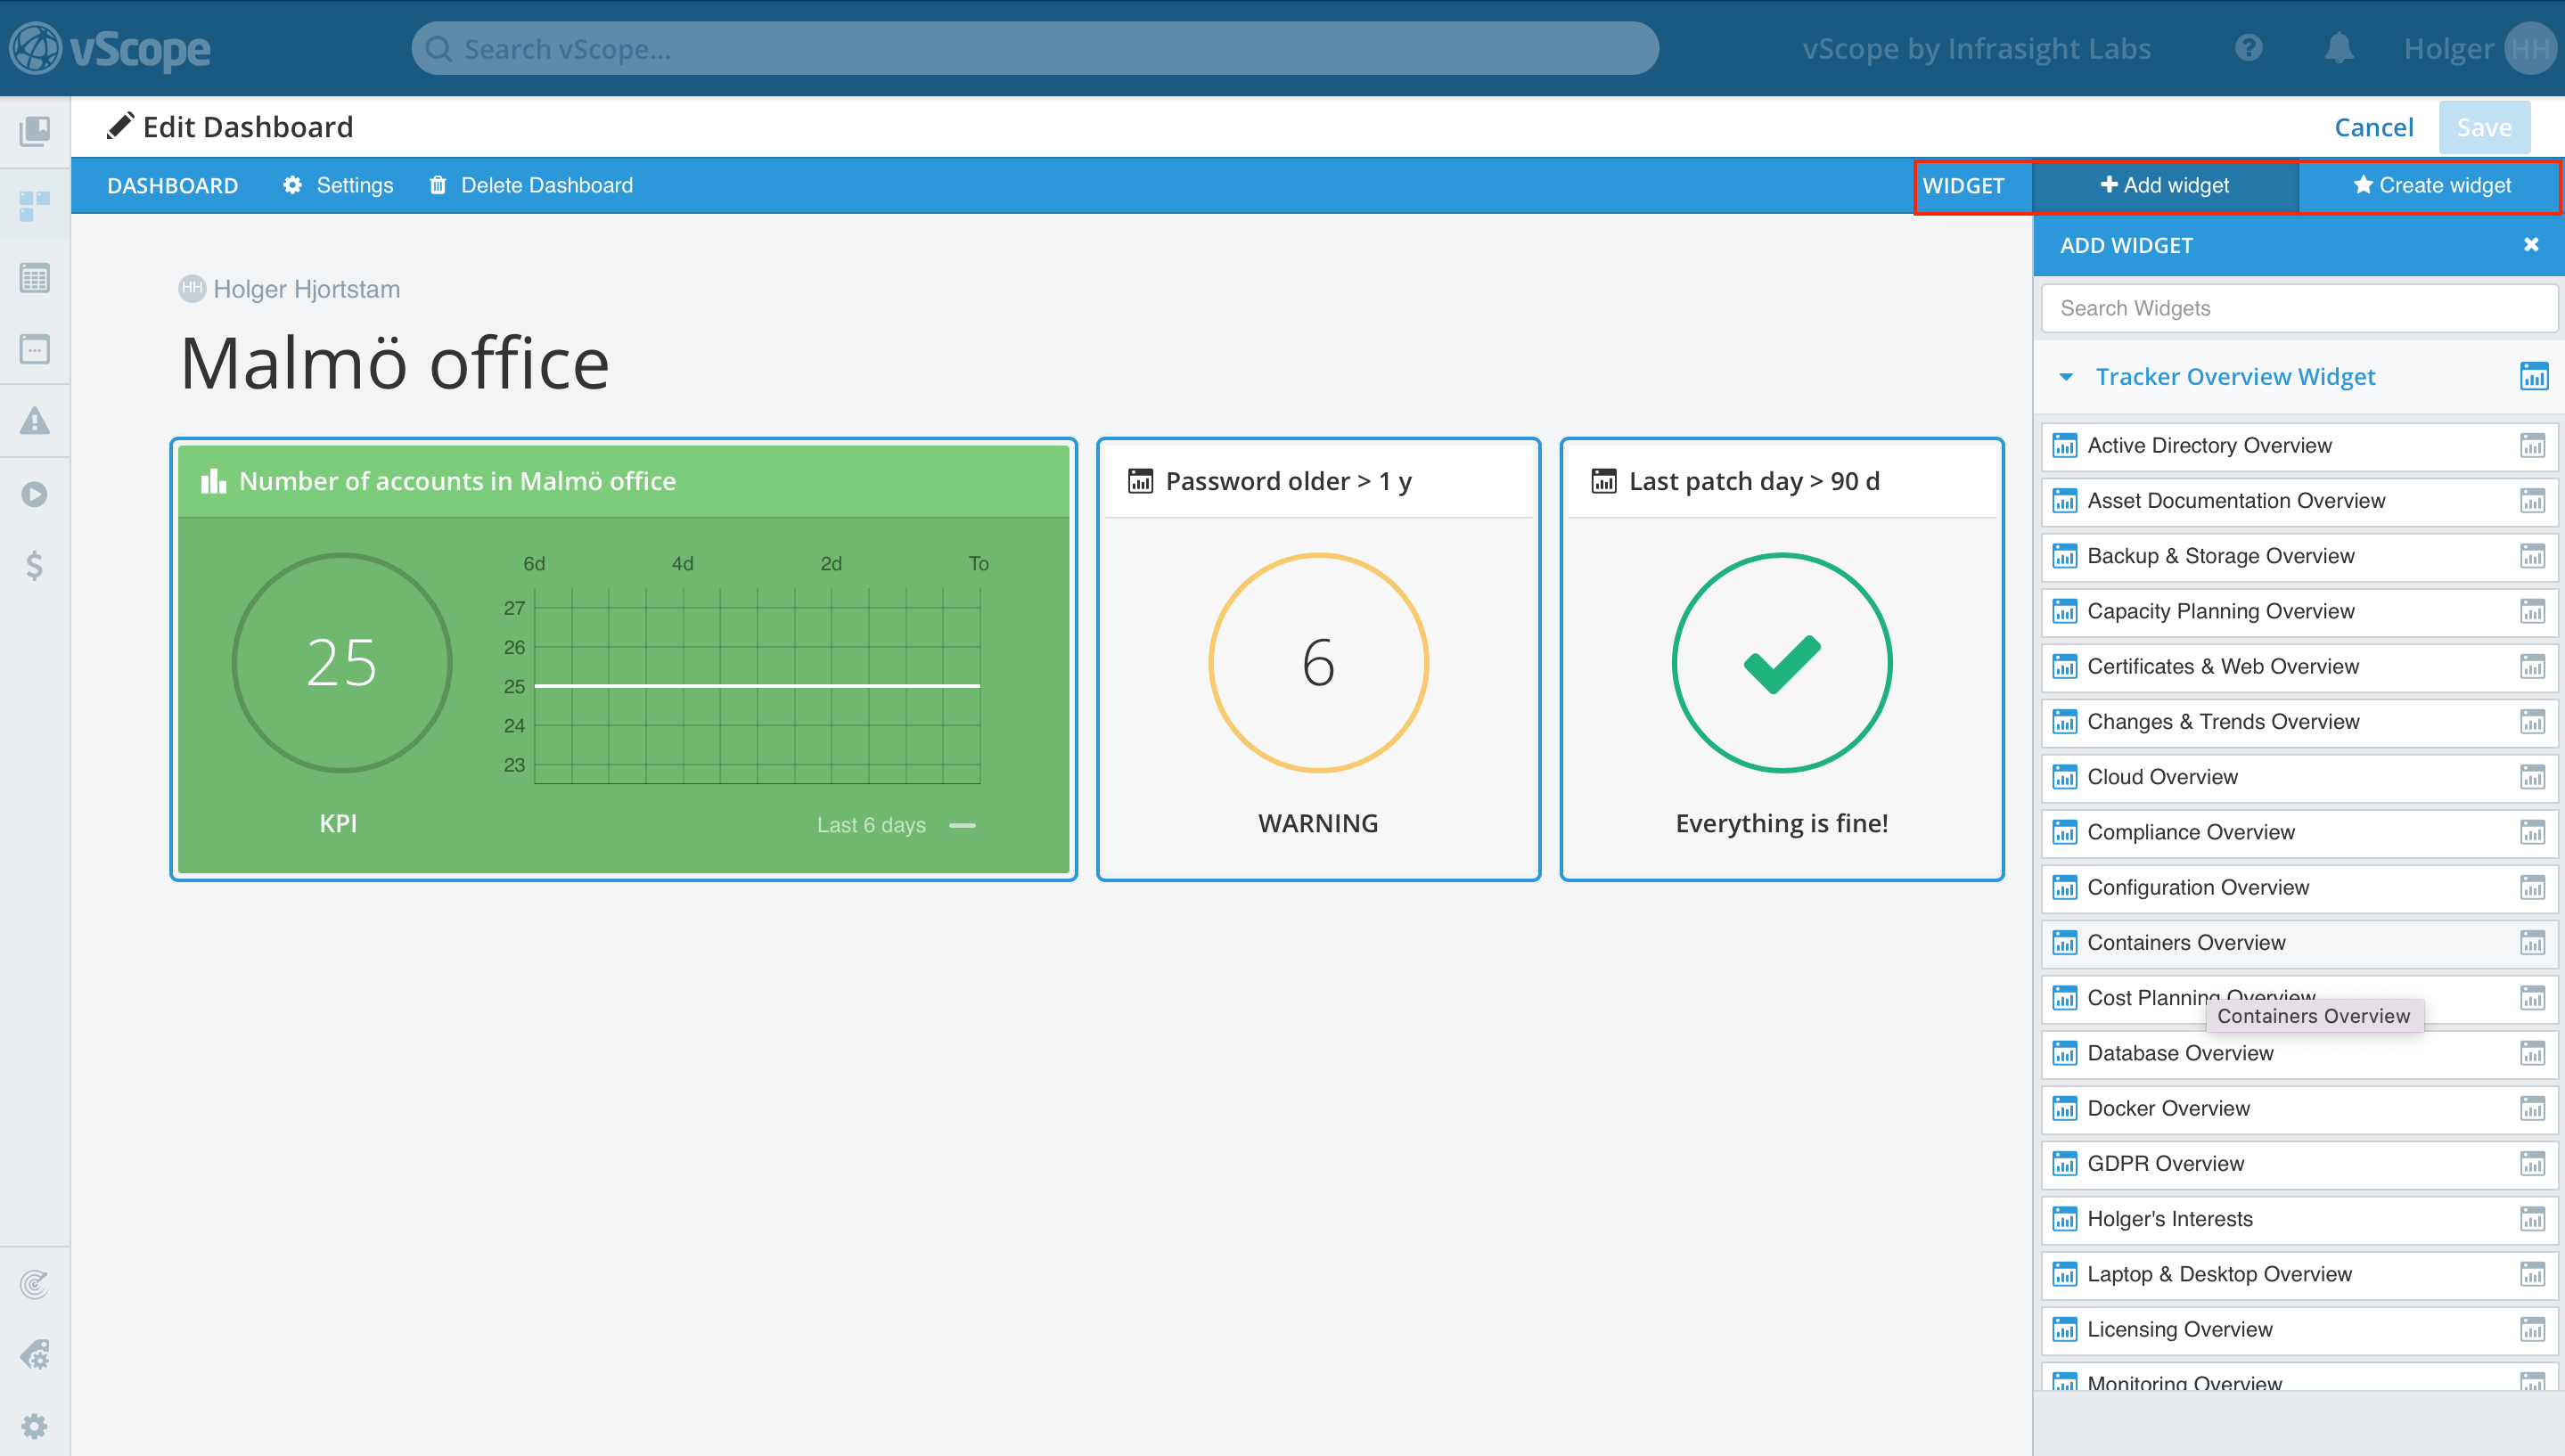
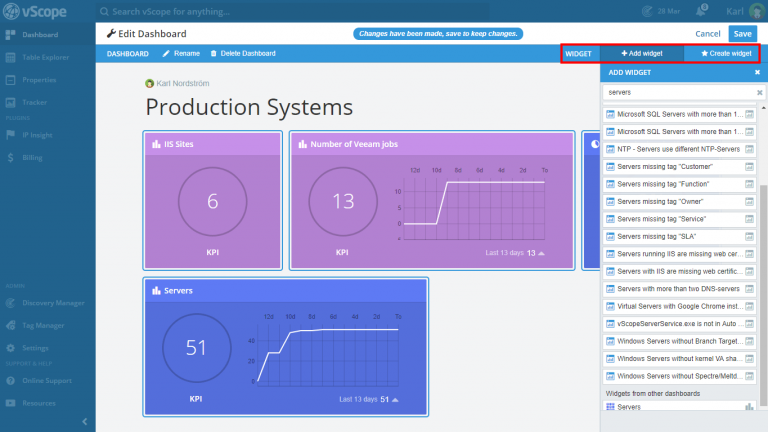
Adding widgets
Click on +Add widget to add widgets to your dashboard. There are two sizes for every widget. Click or drag the widget if you would like to choose the extended size.
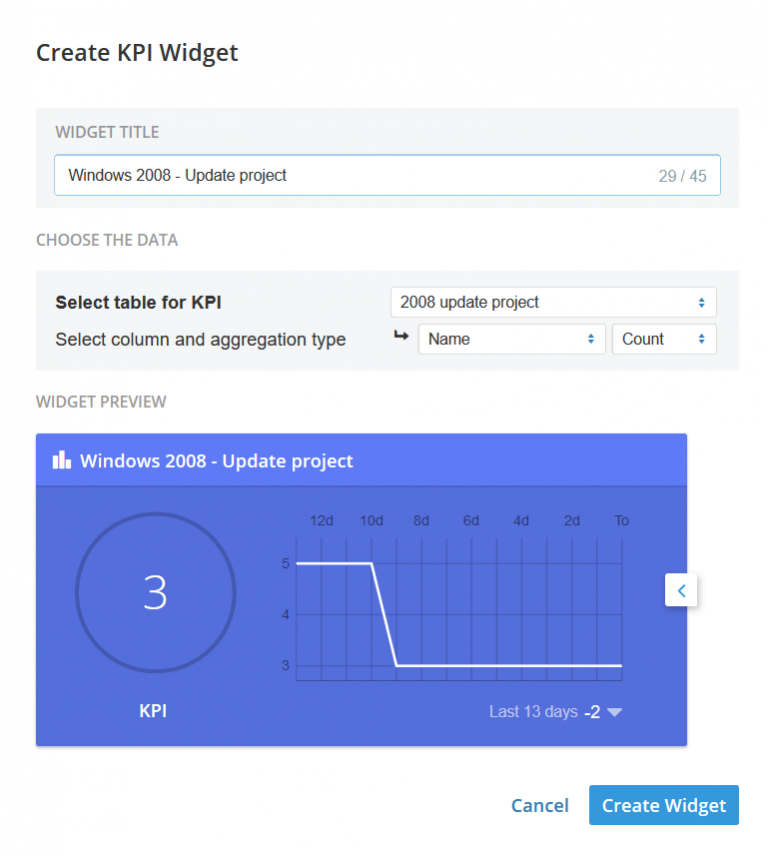 Create your own Widgets from your reports
You can make your own widgets based on reports you have created. You can do this by clicking the button in the dropdown menu beside Save Table.
PRO TIP! You can create unlimited dashboards so why not create one for every system, technical area, or just one that combines all KPIs that are personally important to you?