The Dashboard provides a direct window into vScope, the data collected and highlights the most important information. In addition there is access to collaborative features that allows for building common views for colleagues for meetings, project plans, follow-ups, compliance and much more.
1. About Dashboards
Dashboards consists of widgets. A widget is dependant on a table that’s built in Table Explorer. Add favourite widgets to a dashboard and favourite dashboards.
There are two type of dashboards.
1.1. Bundled dashboards (from InfraSight Labs)
These dashboards are provided by vScope. They are designed and maintained by InfraSight Labs. It is not possible to edit or customize collaboration of these dashboards.
1.2. User created dashboards (from users)
Create dashboards customize them for the organization’s need. Edit and share these to other colleagues that are vScope users.
2. Sharing & Collaboration
Manage permissions of a dashboard under the Collaboration setting. This decides what other users that can view the Dashboard.
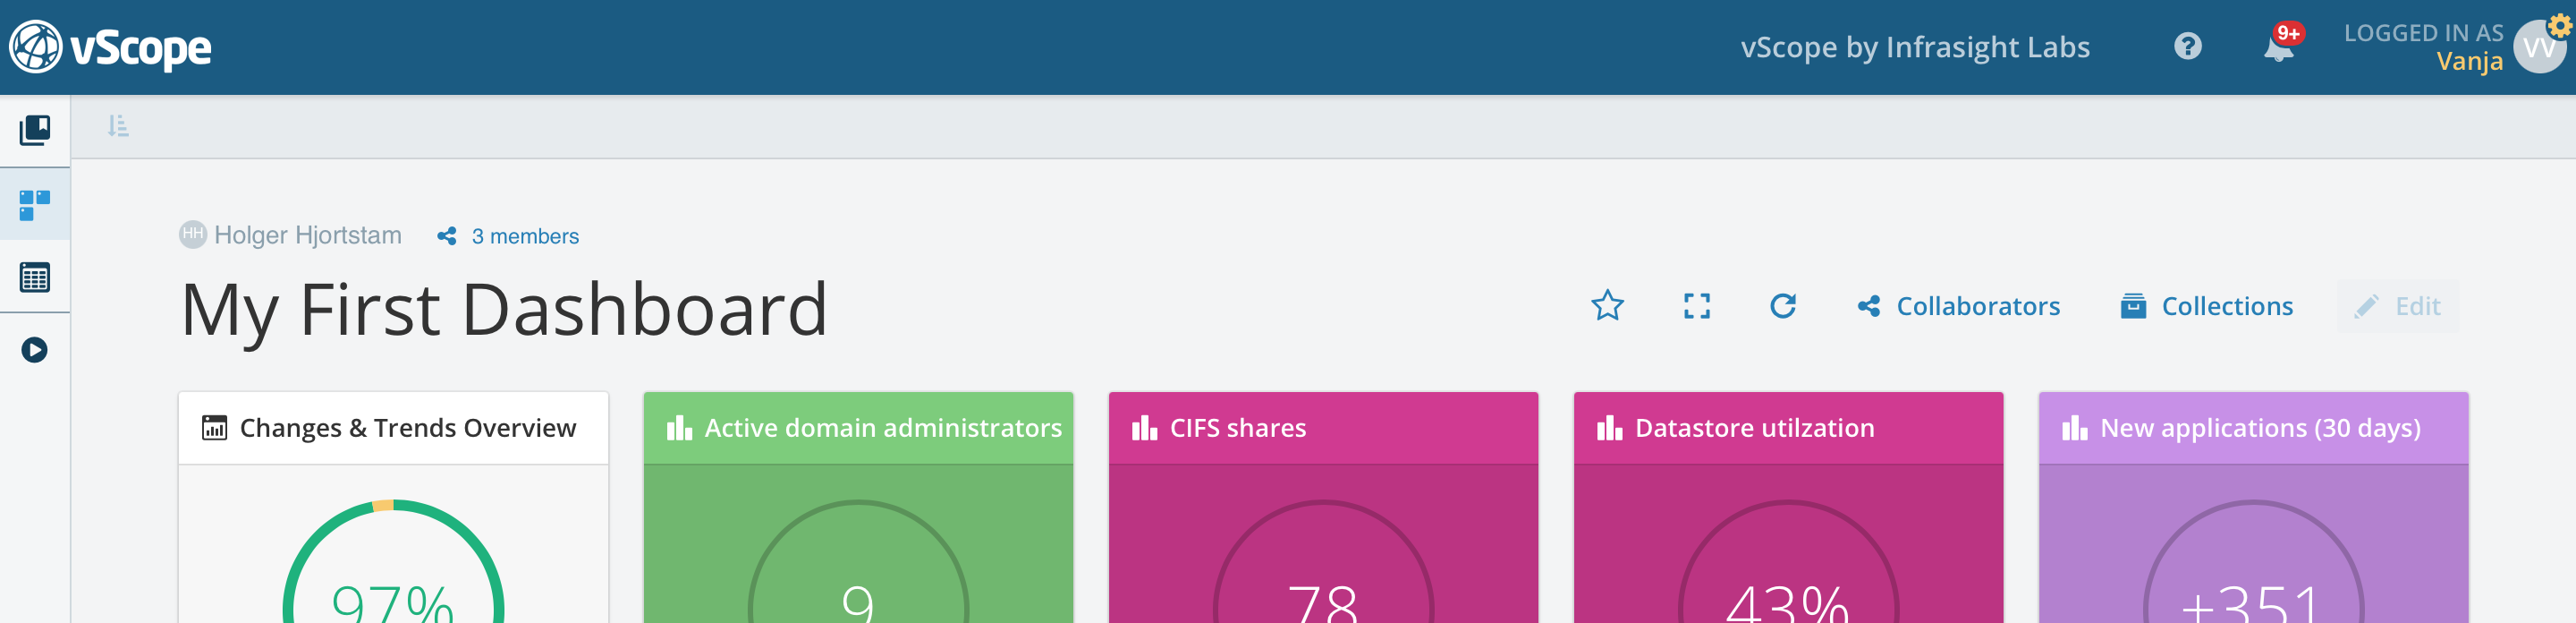
A user can either have Read or Write permissions on a dashboard. All vScope Admins will automatically have write permissions on all dashboards. In the example below, the colleagues John and Vanja are added to a dashboard. Only John will have write access (making changes to the dashboard).
How it looks for Vanja:
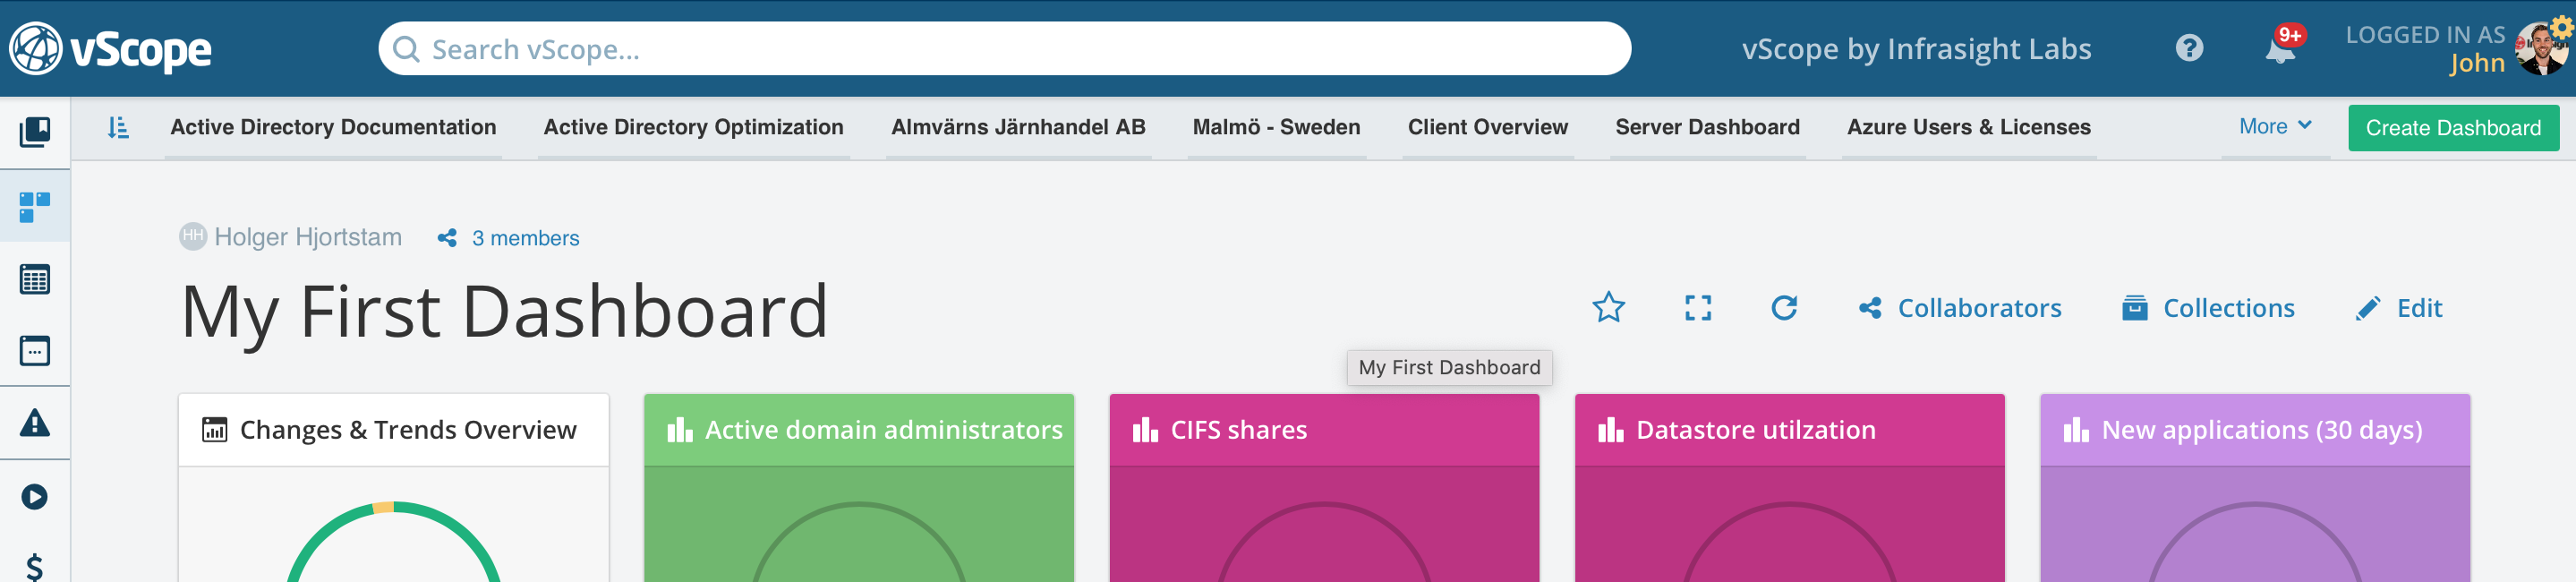
How it looks for John:
All widgets (See 3.4.) are connected to an underlying tables, vScope therefore evaluates if the user have access to read the underlying table. This means that if the user is not allowed to access the table the widget is built upon, the user will not be able to click the widget to view more details.
Note: Administrators can always edit shared dashboards.
3. Manage Dashboards
Manage your dashboards by clicking the star button making them your favourites. This can be done in the library under dashboards or directly while looking at the dashboard.
3.1. Favourite dashboards
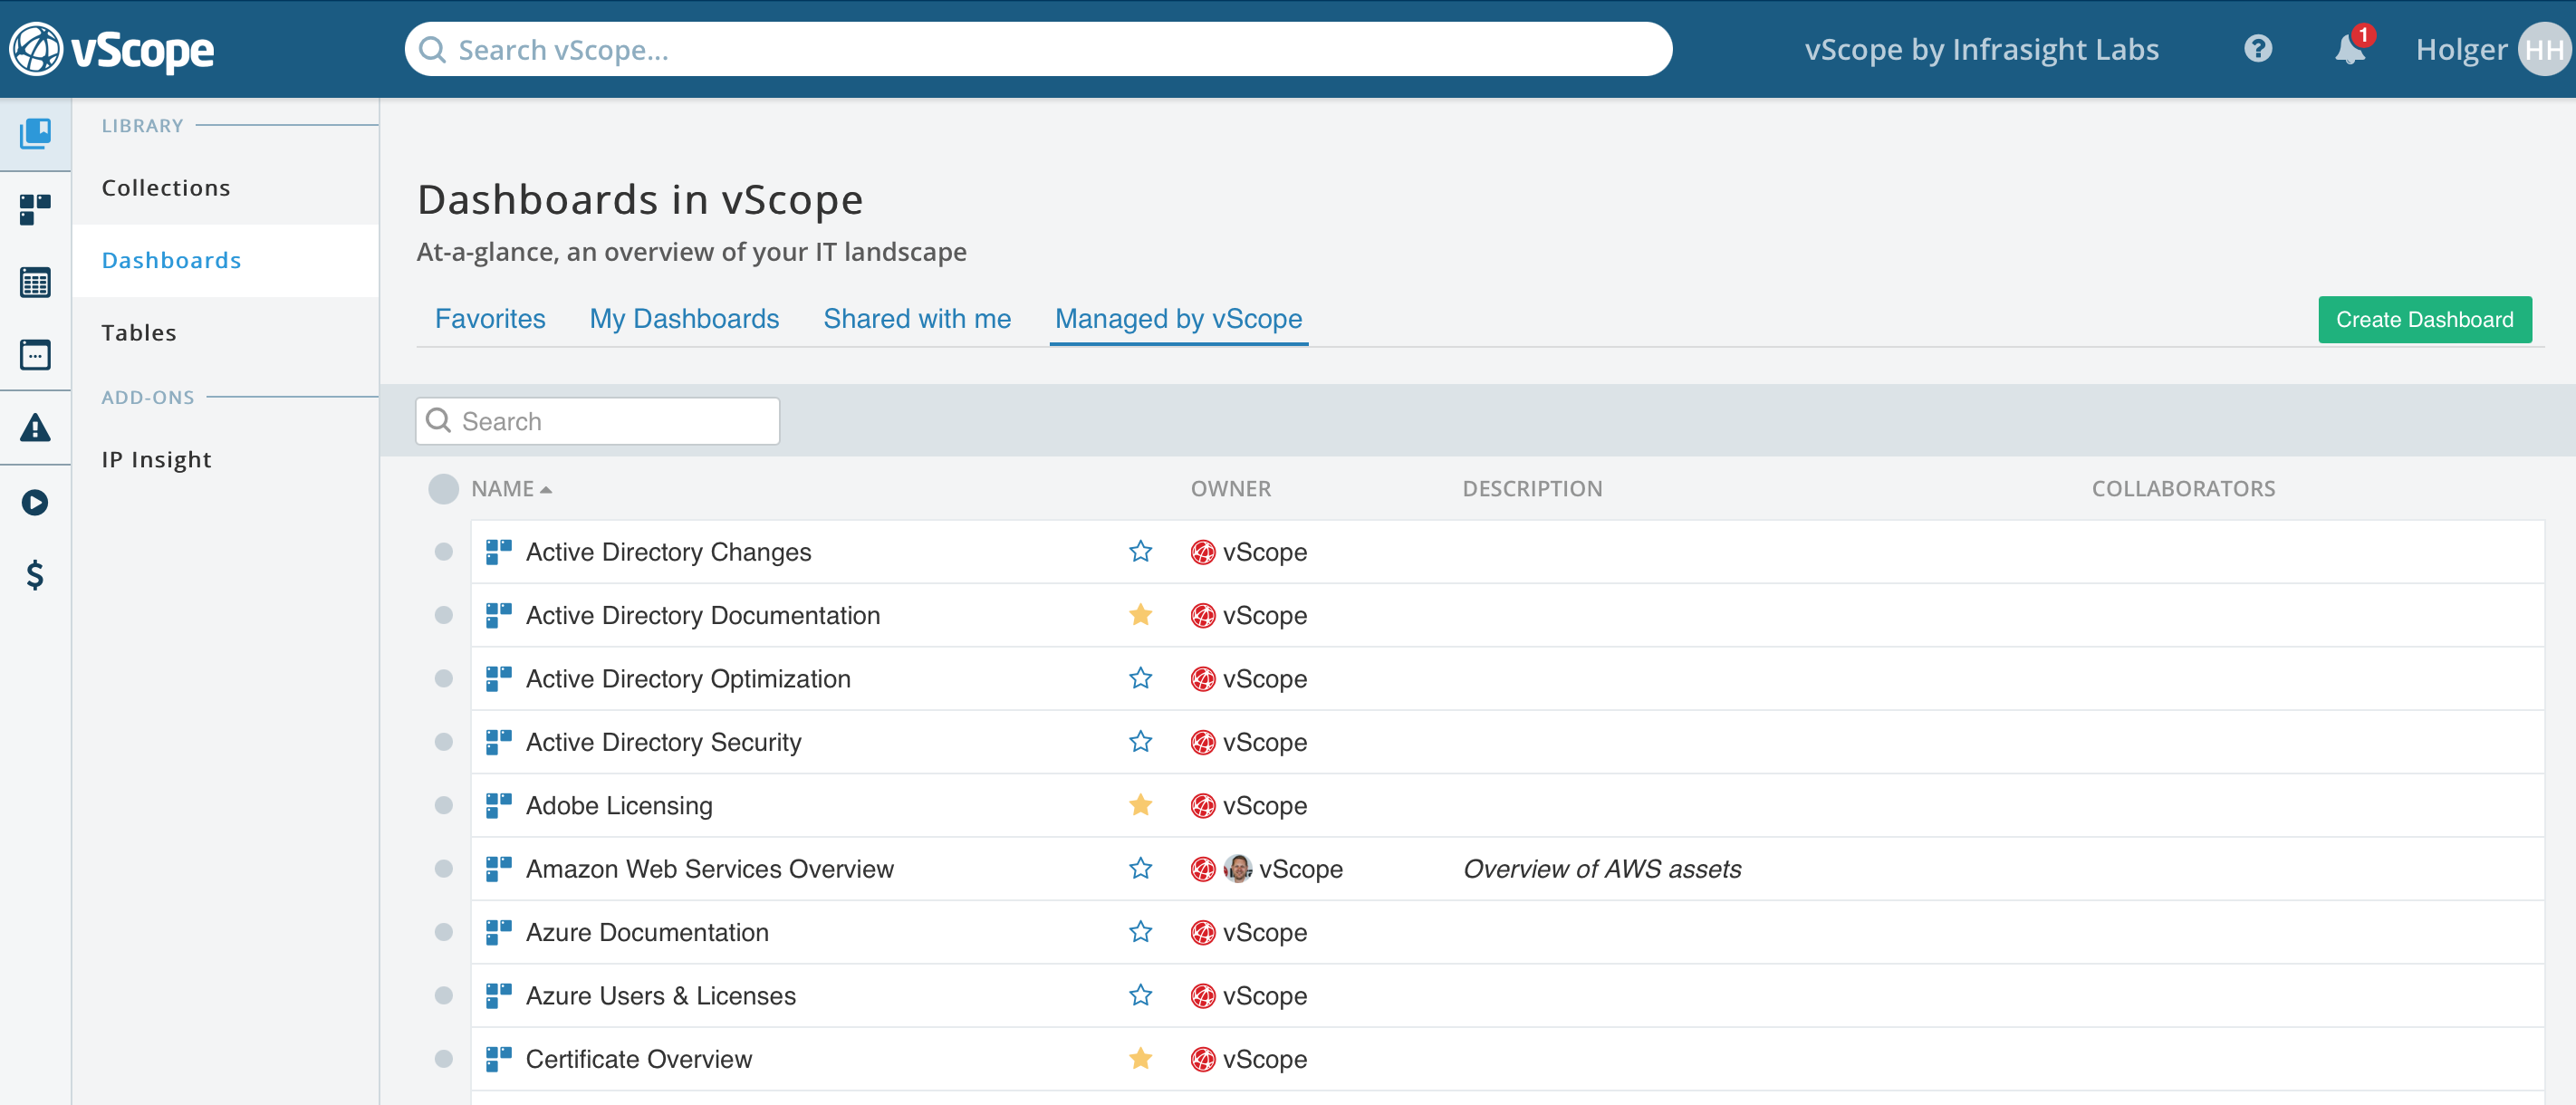
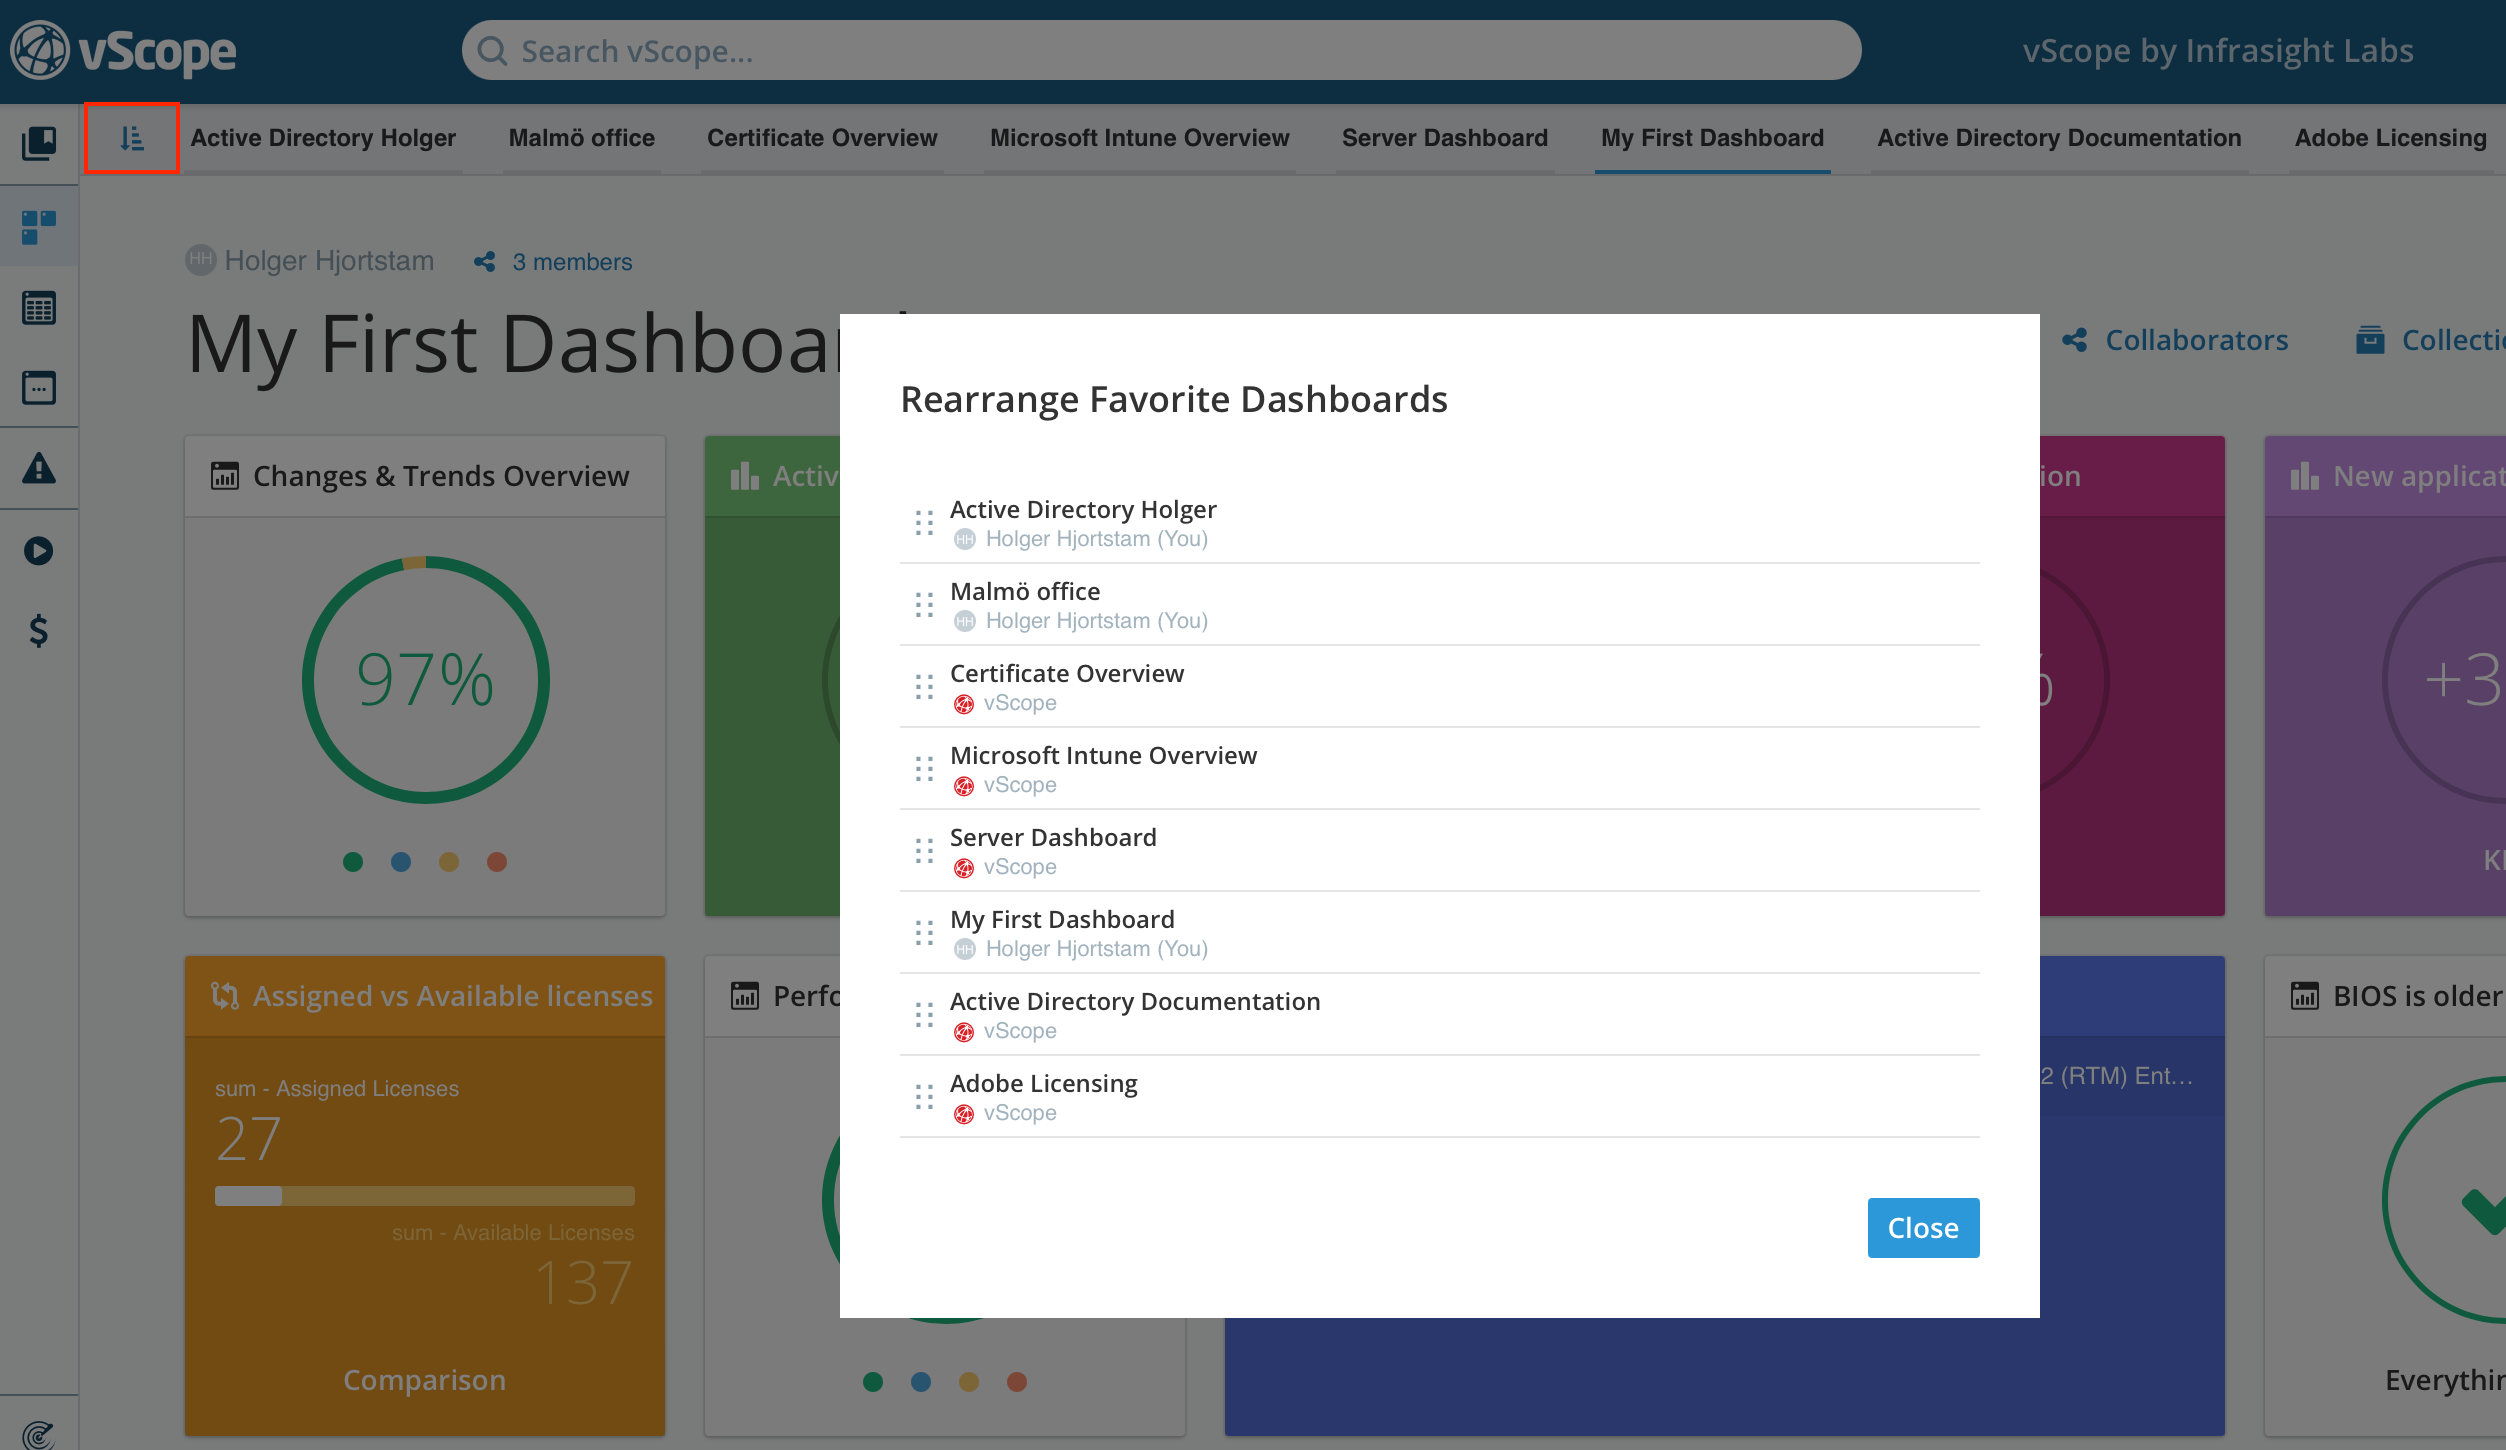
Favourite dashboards will now appear in the dashboard quick access menu.

By clicking ![]() you can change the order of the favourites.
you can change the order of the favourites.
3.2 Creating a Dashboard
Click “Create Dashboard”. This will automatically create a Dashboard and lead to the “Edit mode”.
4. Edit Dashboard
In Edit Dashboard it is possible to choose what information to view on the dashboard. Customize widgets and change name of the dashboard.
5. Widgets
Widgets are a representation of the content of one or more tables. There are different kinds of widgets, all with some specific benefits for visualizing important metrics. Every widget comes in two sizes: 1×1 or 2×1. Add widgets from the right-hand side of the screen when in edit mode.
There’s no cap on the number of widgets on a dashboard.
5.1. KPI widget (Key Performance Index)
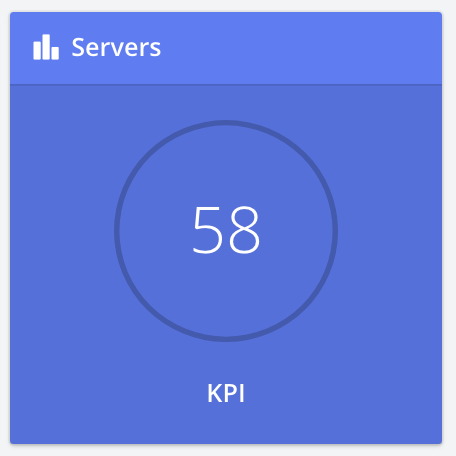
A KPI widget is a visualization of a number in a table. This can be count, sum, average or unique. It helps answer simple but important questions about eg. number of servers, number of databases, total file system size, average number of applications/server. The 2×1 size of the KPI widget also includes history.
5.2. Ratio widget
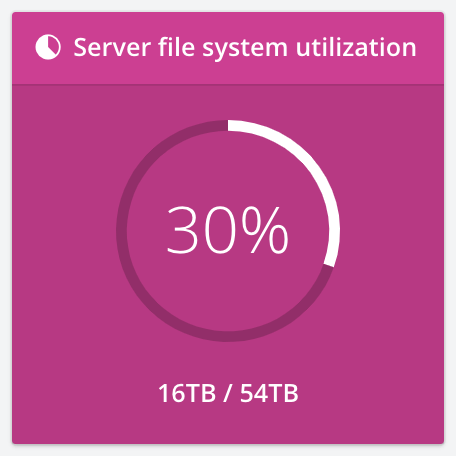
The Ratio widgets shows a relation between two values (between one or two tables). Examples are row counts, sum or average of a table. This is important in cases when one want to know more about eg. utilization. The larger size (2×1) of the Ratio widgets includes history.
5.3. Top 5 widget
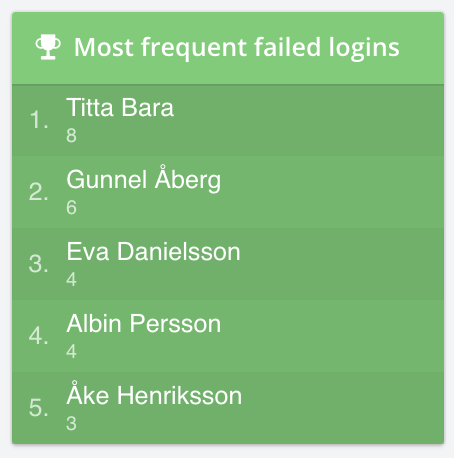
Top 5 widgets lists multiple values from a resource in one widget providing a good overview of, for example:
Which are our largest databases? Most active users? Least used file system? etc. The 2×1 version of this widget includes a third value to shows more details.
5.4. Comparison widget
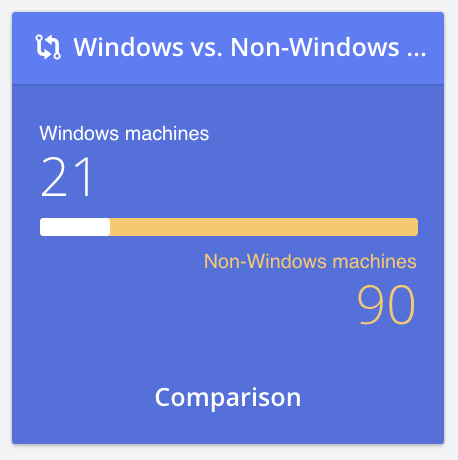
Comparison widget offers comparison of two different numbers in the same widget. A good way to understand how different values relates. In the expanded 2×1 size it’s possible to see a plot of how the two values have changed over time.
5.5. The Tracker Overview
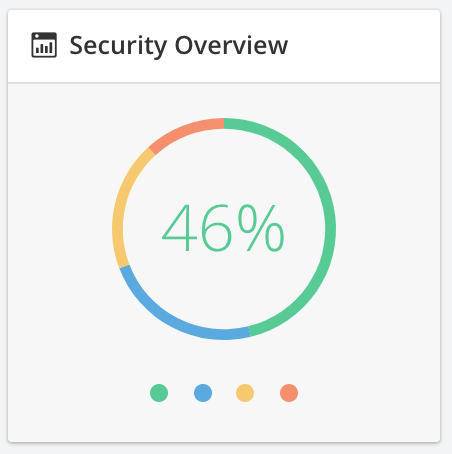
This widget shows valuable information about compliance of the IT. It can either show the overall Tracker performance or choose to only show performance for certain interests eg. security or backup. 2×1 provides more details.
5.6. Single Tracker case
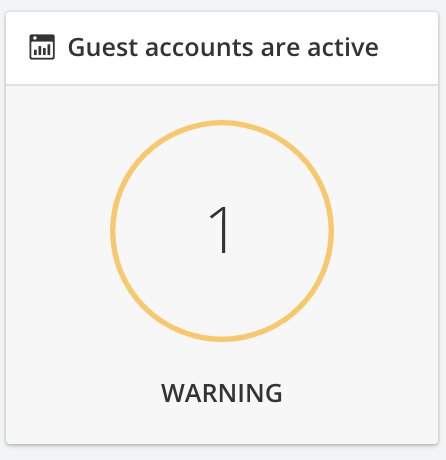
The Single Tracker case widget shows the result of any analysis. Notice that the circle will turn green, yellow or red depending on the severity of the case. Expanded version gives more details.
5.7 Creating a widget
It is possible to design personal widgets instead of using those that are bundled with vScope. This is done by clicking “Create widget” in edit mode. Repetition: Every widget depend on information from tables. This means that it is necessary to either build tables in Table Explorer or make use of the Tailored recommendations that comes bundled with vScope when creating widgets.
To build a widget one needs a table, select a column from the table to visualize in the widget and what aggregation type.
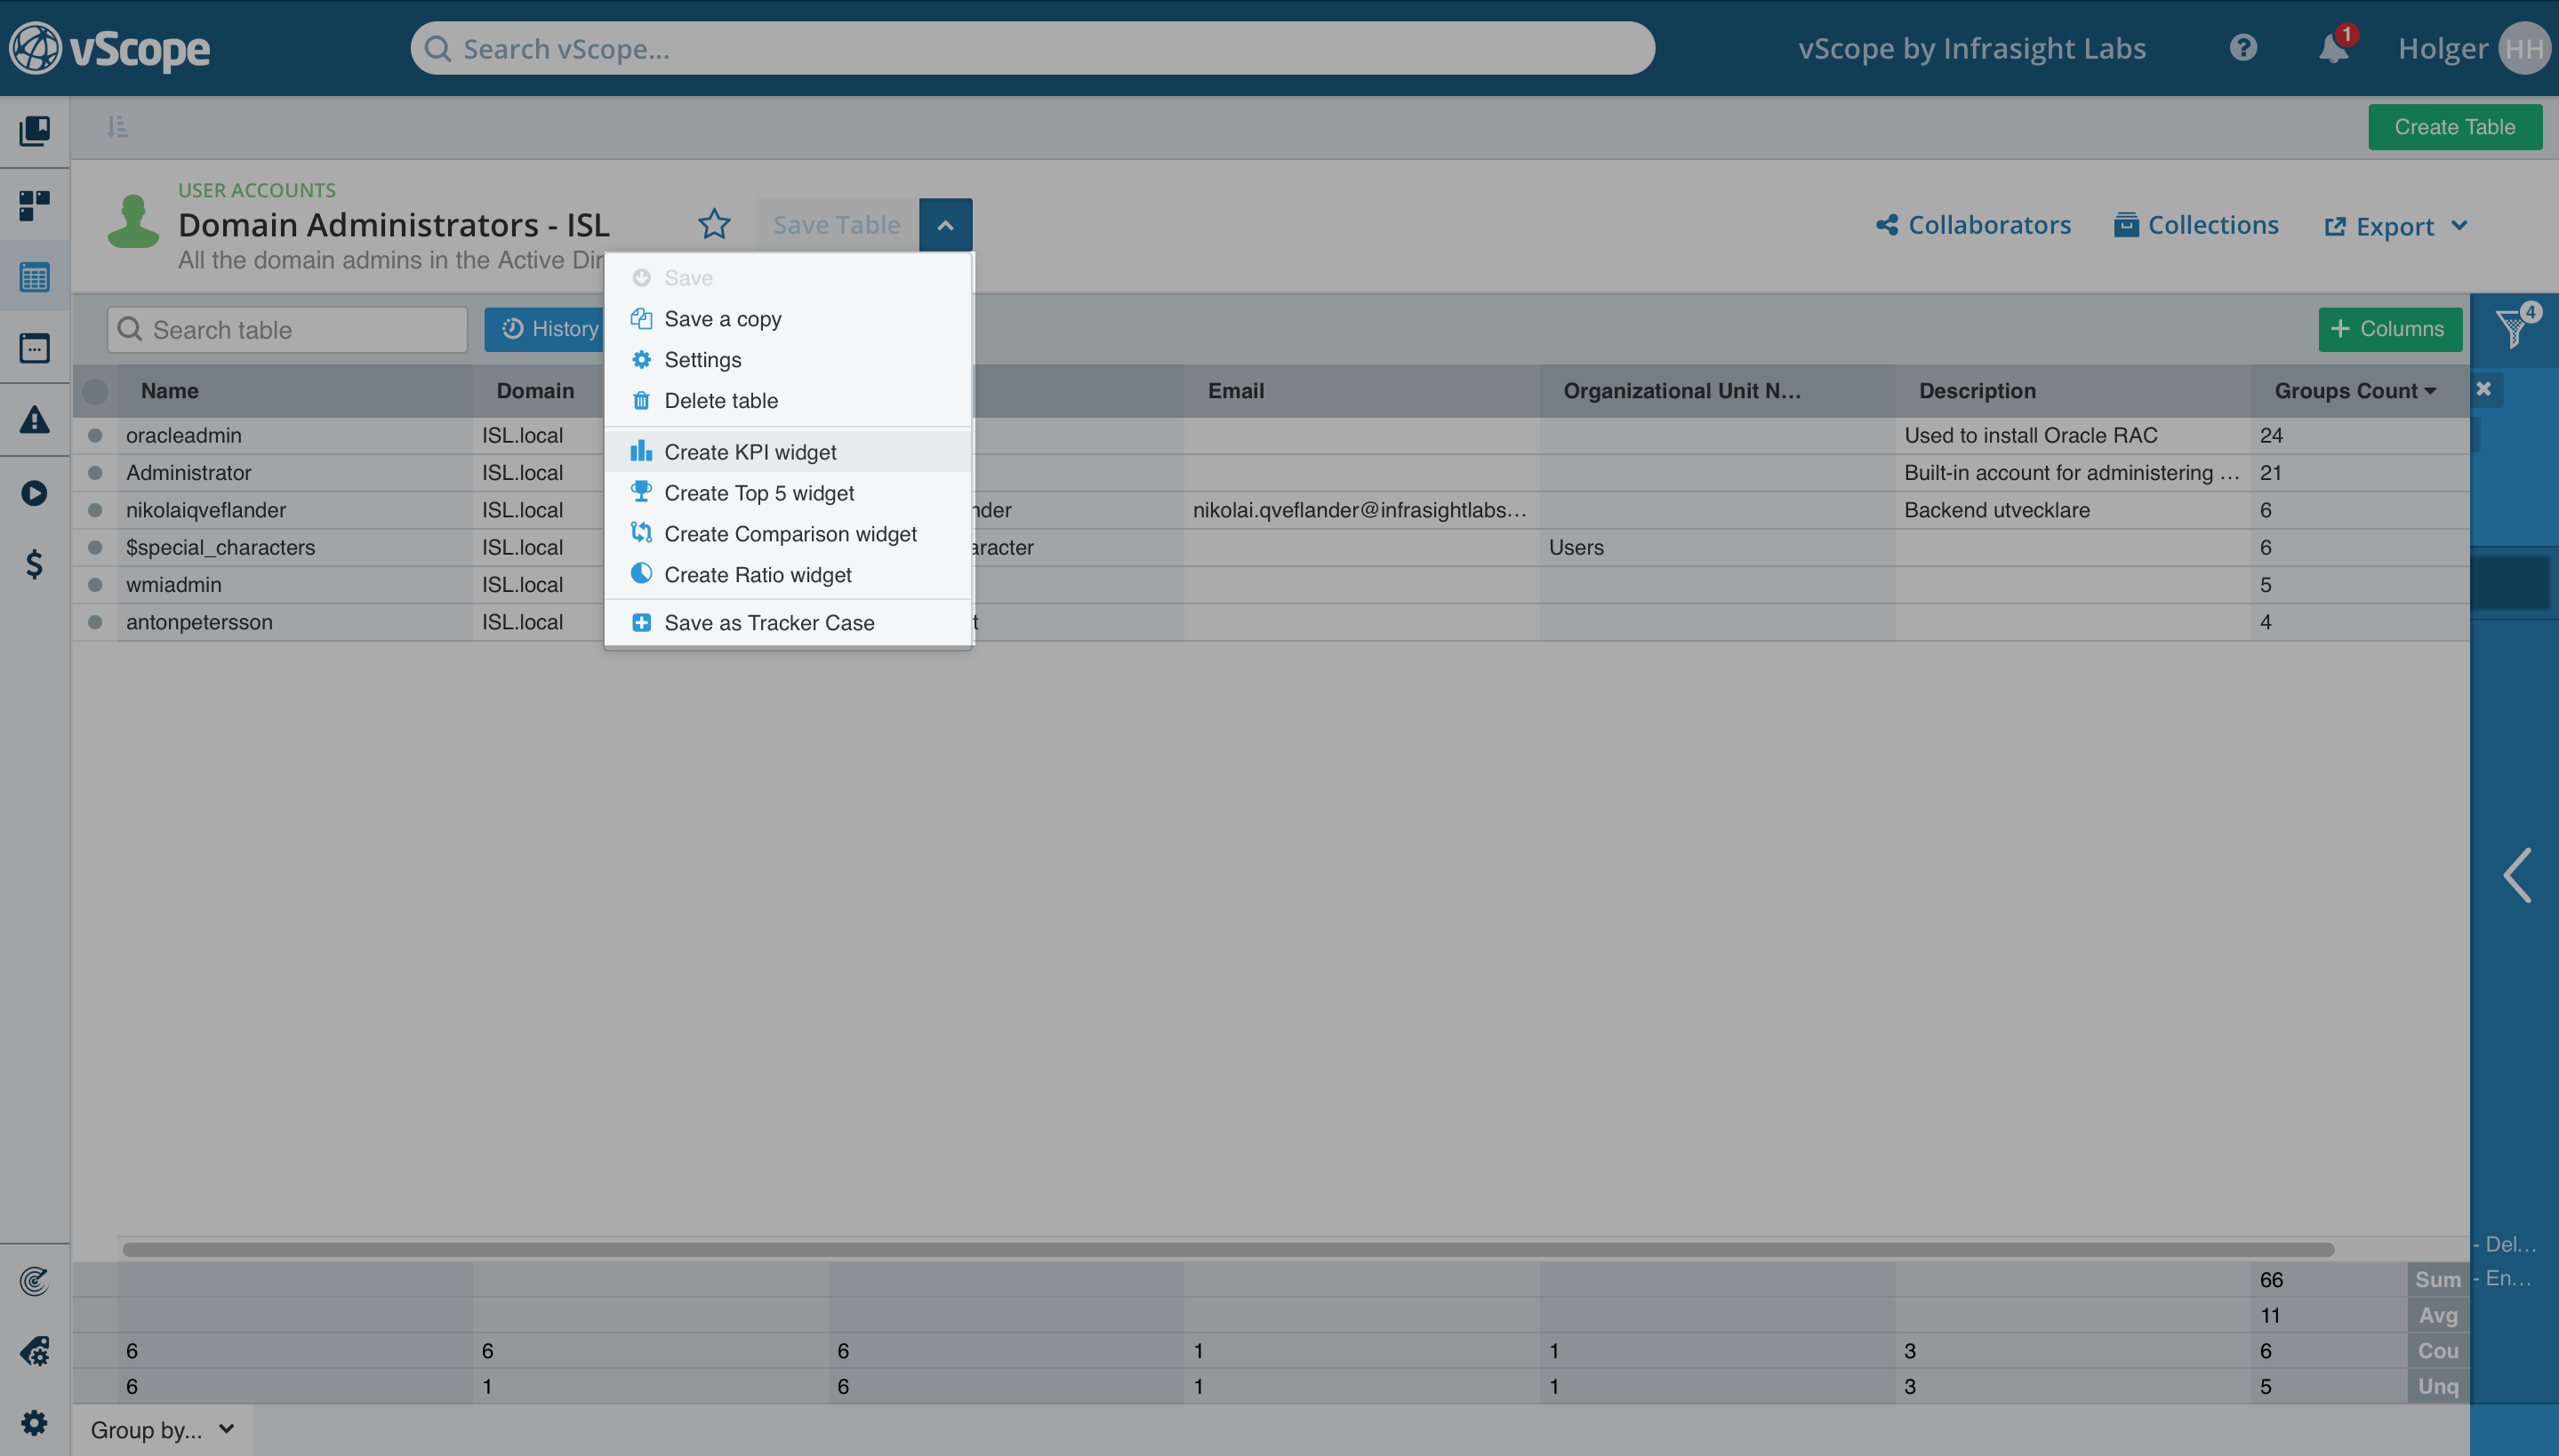
It’s also possible to create a widget directly from a table in Table Explorer.
6. Title
Change the name of dashboards in Edit mode. Note that it is not possible to edit the name of pre-made dashboards.
7. Auto refresh
The auto refresh option enables updated widgets without having to reload the browser. Perfect for presenting dashboards on monitors.
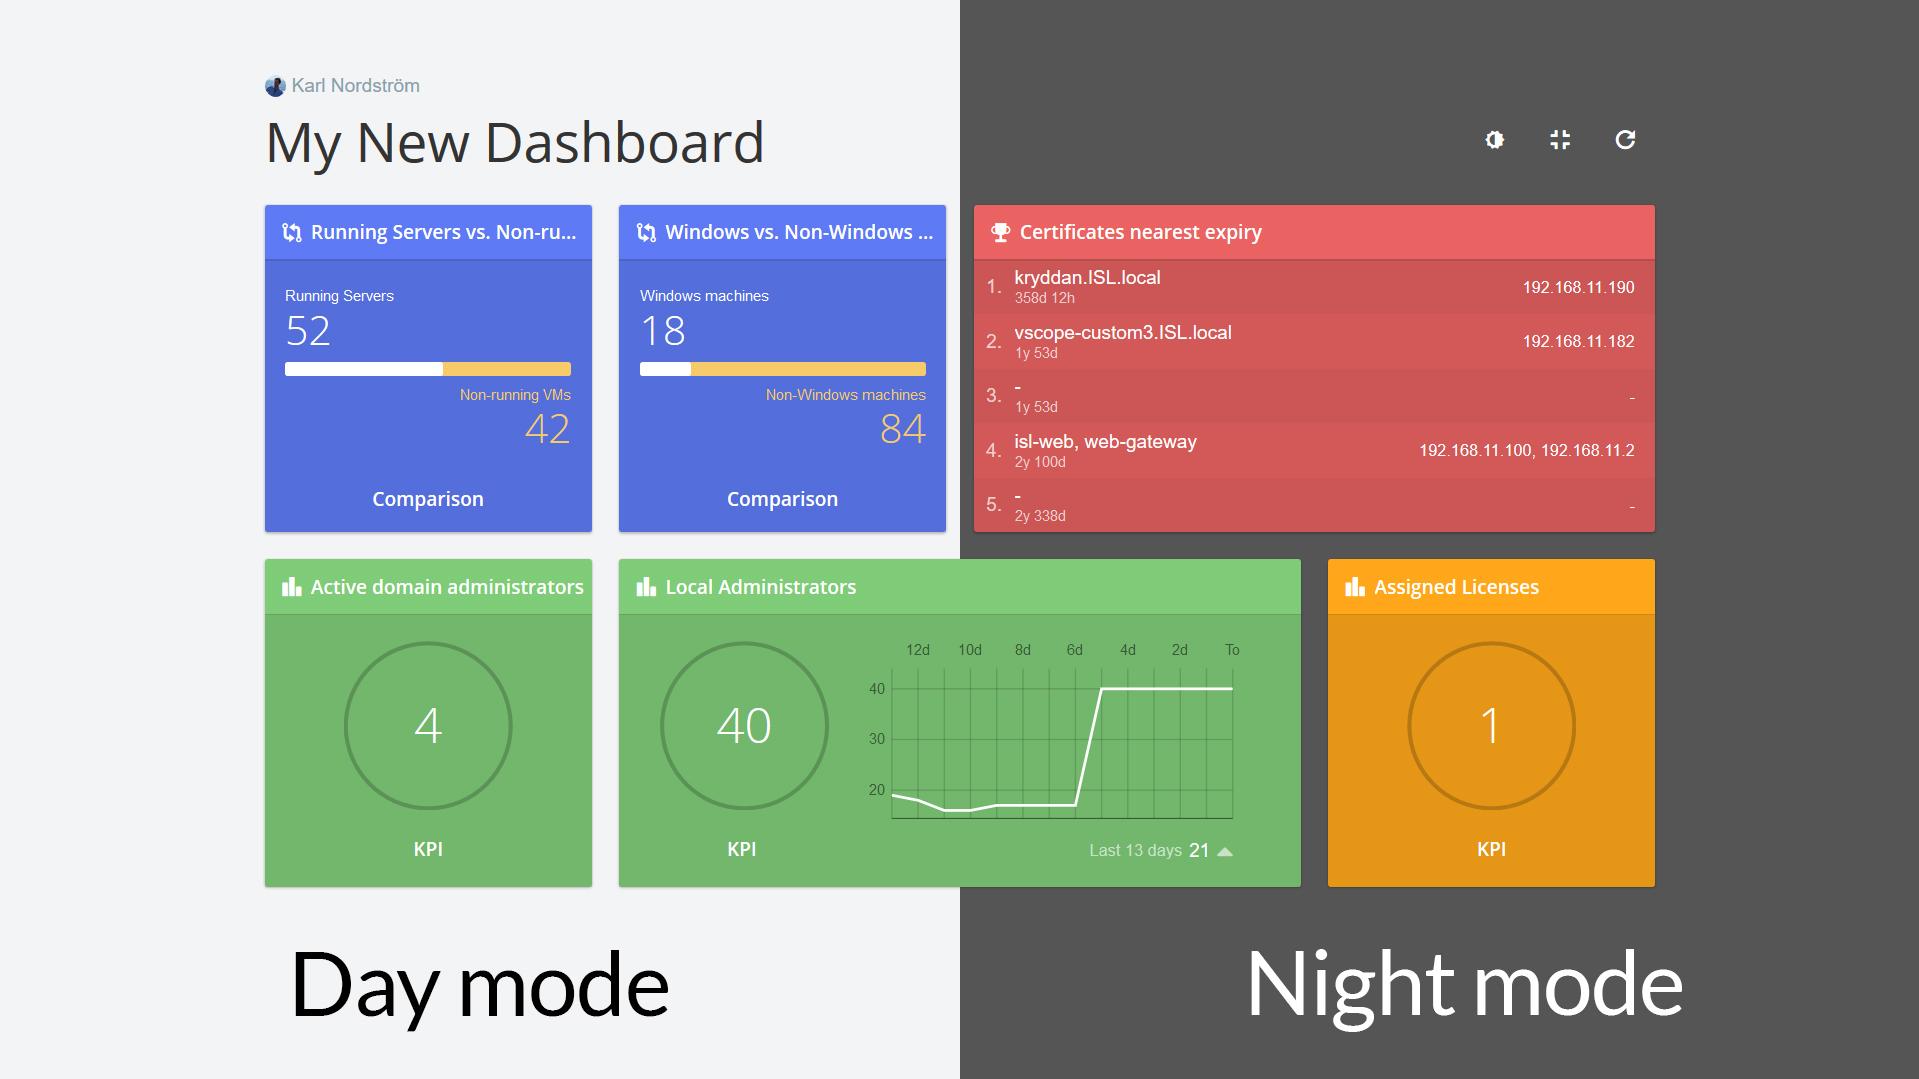
8. Full Screen
Allows for a full screen view of the dashboard. Switch between between day and night mode.